Crypto derivatives explained for active traders: how futures, perpetual futures, options and swaps work, how margin and funding are calculated, and the risks.
Crypto 2026 predictions explained for traders. If markets feel less forgiving, here’s why institutions, ETFs, and structure are changing how crypto moves.
Solana (SOL) has been trading within a defined accumulation range.
All information on this site is provided by Mubite for educational purposes only, specifically related to financial market trading. It is not intended as an investment recommendation, business advice, investment opportunity analysis, or any form of general guidance on trading investment instruments. Trading in financial markets involves significant risk, and you should not invest more than you can afford to lose. Mubite does not offer any investment services as defined under the Capital Market Undertakings Act No. 256/2004 Coll. The content on this site is not directed toward residents in any country or jurisdiction where such information or use would violate local laws or regulations. Mubite is not a brokerage and does not accept deposits. All trading accounts provided by Mubite are simulated demo accounts using live market data. No client funds are traded on live markets. Payout figures shown are individual results and are not typical. Past performance does not guarantee future results.
Mubite s.r.o., Školská 660/3, Nové Město, ICO: 23221551 Praha 1, 110 00, Czech Republic | Copyright Ⓒ 2026 Mubite. All Rights Reserved.
Learn how crypto prop traders profit in any market. Master trading cycles, manage risk with funded capital, and turn volatility into consistent opportunity.
If you’ve traded crypto for any length of time, you’ve lived through the emotional rollercoaster. Bitcoin rallies, everyone around you talks about easy money, and social media turns into one big victory lap. You jump in, your confidence grows, and then the market turns. Suddenly your “smart entry” becomes a slow bleed of red candles.
Most traders experience the same cycle of hope and regret. They celebrate during bull markets and vanish during bears. It’s not because they’re bad traders. It’s because they’ve never learned to read the market’s rhythm.
Bull market: prices rise 20% or more from recent lows over a sustained period, driven by optimism and new money
Bear market: prices fall 20% or more from recent highs, driven by fear and falling volume. A long one in crypto is called a crypto winter
How long: Bitcoin’s last three bear markets lasted about 12 months each, with drops of 77% to 85%. Bull phases from the bottom to the next peak have run close to three years
How to tell: price vs the 200 day moving average, the structure of highs and lows, funding rates, and volume
How to trade: follow trends in a bull, trade short setups and bounces in a bear, size down in sideways chop
A bull vs bear market describes the direction of the broader trend, not a single day's move. The common benchmark, used across stocks and crypto, is a 20% move from the most recent high or low, while a drop of 10% to 20% is usually called a correction.
What Is a Bull Market?
A bull market is a sustained period of rising prices. In crypto you usually see:
Higher highs and higher lows on the daily and weekly chart
Rising volume on up days and new money entering the market
Positive funding rates, as more traders pay to hold leveraged longs
What Is a Bear Market?
A bear market is a sustained period of falling prices, 20% or more from the recent high. Typical signs:
Lower highs and lower lows, with rallies that fail at resistance
Volume concentrated on down days, and capital rotating into stablecoins
Flat or negative funding rates as traders lean short
| Information | Bull Market | Bear Market |
|---|---|---|
| Price direction | Rising, higher highs | Falling, lower lows |
| Sentiment | Optimism, then greed | Fear, then apathy |
| Volume | Heavier on up days | Heavier on down days |
| Funding rates | Mostly positive | Flat or negative |
| Typical strategy | Trend following, buying pullbacks | Short setups, selling failed rallies |
In crypto, the strongest stretch of a bull market is often called a bull run. Bullish and bearish describe a view rather than a market: bullish means you expect prices to rise, bearish means you expect them to fall.
Bitcoin's history gives a rough guide to the average length of a bull market vs a bear market. Each of the last three bear markets ran for about a year
| Bear market | Peak to trough | Decline | Duration |
|---|---|---|---|
| 2013 to 2015 | $1,147 to $152 | about 87% | about 400 days |
| 2017 to 2018 | $19,665 to $3,122 | about 84% | about 350 days |
| 2021 to 2022 | $69,044 to $15,479 | about 77% | about 380 days |
The bull phases in between lasted much longer. Measured from each bottom to the next all-time high, every one ran close to three years: January 2015 to December 2017, December 2018 to November 2021, and November 2022 to October 2025, when Bitcoin peaked at about $126,000.
Warning: Three cycles is a small sample, so treat these as reference points rather than a timetable. Each drawdown has also been smaller than the last, which suggests the market is maturing.
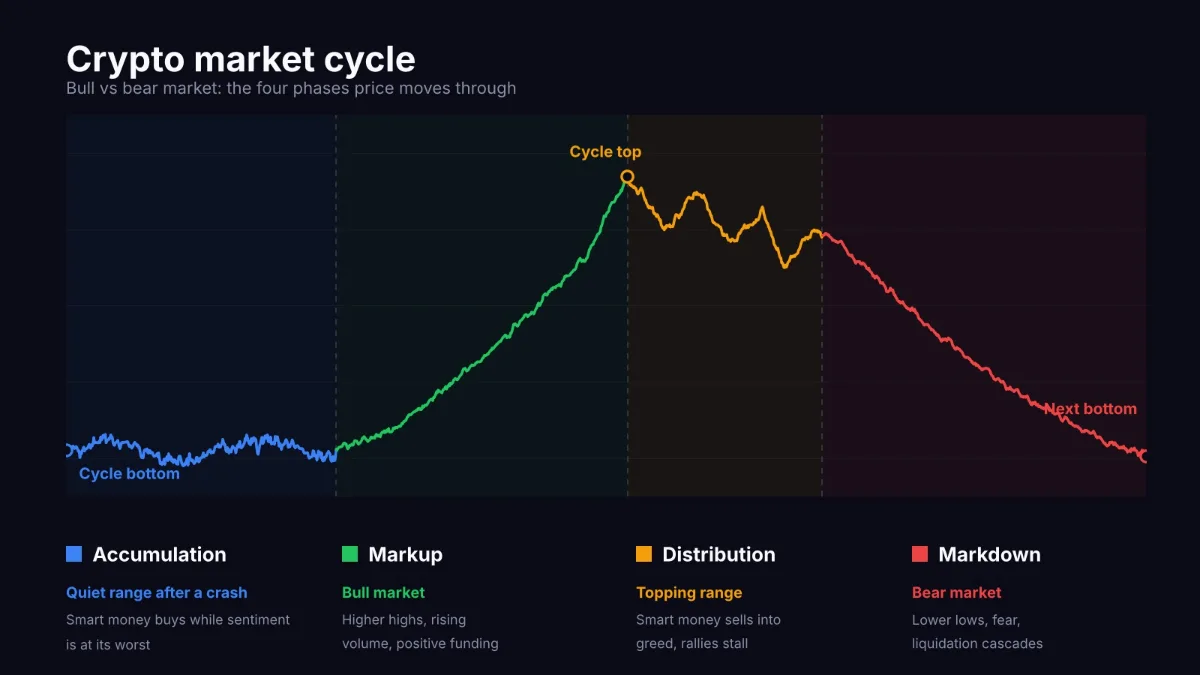
Markets are not random. They move through predictable emotional and structural stages. Recognizing them helps you decide whether to attack, defend, or wait.
1. Accumulation Phase
This is the quiet stage after a crash. Prices move sideways, volume fades, and attention disappears. Retail traders call crypto “dead.” Smart money quietly builds positions here. Example: Bitcoin around $16,000 in late 2022, when fear dominated the market.
2. Expansion Phase (Bull Market)
Momentum returns. Breakouts start to hold. Narratives like “AI coins” or “ETFs” ignite enthusiasm. This is when price accelerates faster than fundamentals. Confidence soars, and retail traders return.
3. Distribution Phase
The uptrend weakens. Smart money sells into strength while the crowd keeps buying. Volatility rises. News is still bullish, but conviction starts cracking.
4. Capitulation Phase (Bear Market)
Panic selling, liquidations, and despair. Prices fall faster than anyone expects. The cycle cleans out excess leverage and greed, setting the stage for accumulation again.
Every major crypto run: 2017, 2021, 2022; followed this rhythm. Once you learn to read it, you prepare instead of predict.

No single indicator calls the market, but when most of these signals agree, you know which phase you are trading in:
The 200 day moving average. Price holding above a rising 200 day average is the classic bull market signal. Price below a falling one points to a bear.
Market structure. Higher highs and higher lows mean a bull trend. Lower highs and lower lows mean a bear trend.
Funding rates. Persistently positive funding rates show traders paying to stay long. Persistently negative funding shows the crowd leaning short.
Open interest. Rising open interest alongside rising price means new money is backing the trend. Rising open interest while price falls means shorts are piling in.
Sentiment. The Crypto Fear and Greed Index staying in extreme greed for weeks usually happens late in a bull. Long stretches of extreme fear usually happen deep in a bear.
Tip from the author: Check these signals on the weekly chart, not the hourly one. A single red day in a bull market looks exactly like the start of a bear on a 15 minute chart. If the weekly structure has not broken, it is usually a pullback, not a new phase.
Every phase rewards a different approach, and most losses come from using the right strategy in the wrong market. Unlike spot investors, funded traders can short as easily as they go long, so a bear market is not a reason to stop trading. It is a reason to change the playbook.
Trade in the direction of the trend. Trend following and buying pullbacks to support or moving averages work best
Let winners run with a trailing stop instead of taking profit at the first resistance
Avoid: chasing vertical candles late in the move, and shorting strength just because price "looks too high"
Look for short setups at resistance, especially relief rallies that fail at the 200 day moving average or a prior support level
Trade smaller. Bear market volatility is sharper, and liquidation cascades can move price several percent in minutes
Take profits faster. Bear market rallies are violent, and gains disappear quickly
Avoid: buying every dip on the assumption that the bottom is in
Tip from the author: In a bear market, the bounce is often more dangerous than the drop. Relief rallies of 20% to 30% are common, and they trap short sellers and dip buyers alike. Wait for the rally to stall at resistance before shorting, rather than shorting into the move.
Between the bull and bear phases, crypto often trades in a range for months.
Switch to range trading and mean reversion: buy support, sell resistance, and target the middle of the range
Cut position size and trade frequency. Choppy markets punish trend strategies
Avoid: overtrading. Breakouts fail far more often in a range, so wait for a confirmed break before switching back to trend mode
Waiting for the perfect market. Every phase has setups. Traders who only trade bull markets sit out half the cycle
Treating drawdown limits as the enemy. Limits are what keep a bad week from becoming a blown account, especially in a bear market. See drawdown explained
Ignoring psychology. Greed peaks at the top of a bull and fear peaks at the bottom of a bear. The trader who notices those emotions in themselves can trade against the crowd instead of with it
The names come from how each animal attacks. A bull thrusts its horns upward, and a bear swipes its paws downward. That is also the easiest way to remember which is which: bull means up, bear means down.
No. A correction is a decline of 10% to 20% from a recent high and is usually short-lived. A bear market is a decline of 20% or more that lasts for months. In crypto, 20% to 30% pullbacks within a bull market are common, so the trend structure on the weekly chart matters more than the percentage alone.
Based on Bitcoin's last three cycles, about 350 to 400 days from peak to trough. Bull phases have lasted close to three years.
Share it with your community