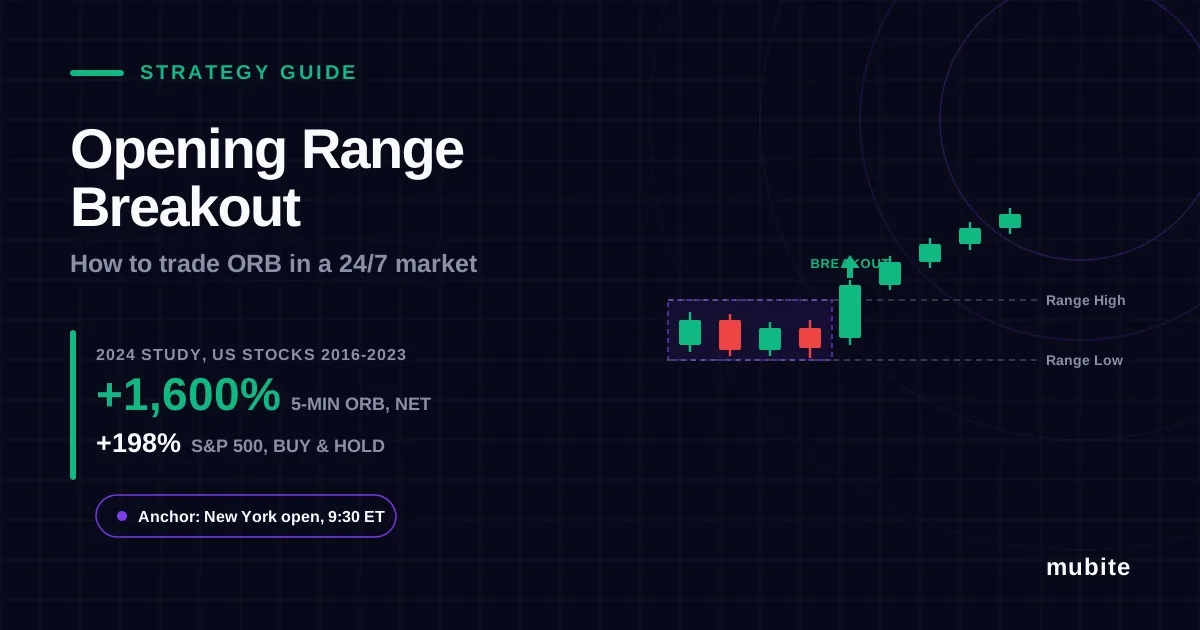
Does opening range breakout work in a market that never closes? How the ORB trading strategy works, what the research shows, and how to set it up for crypto.
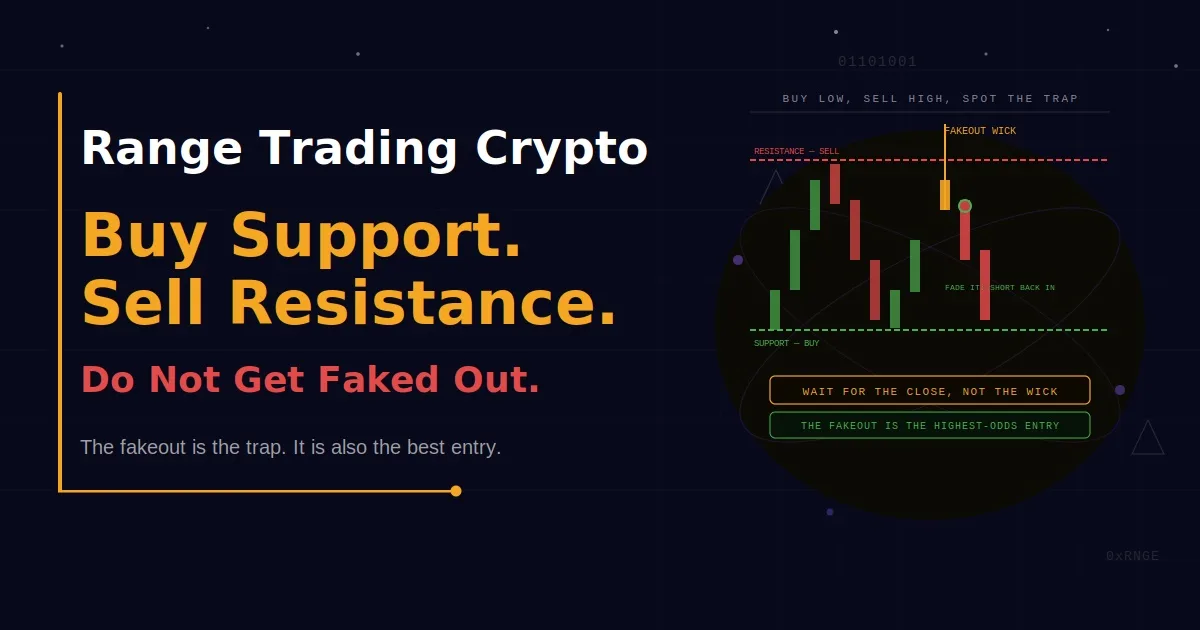
A complete range trading crypto guide. Learn to buy support and sell resistance, avoid the fakeouts and know exactly when a range has ended.
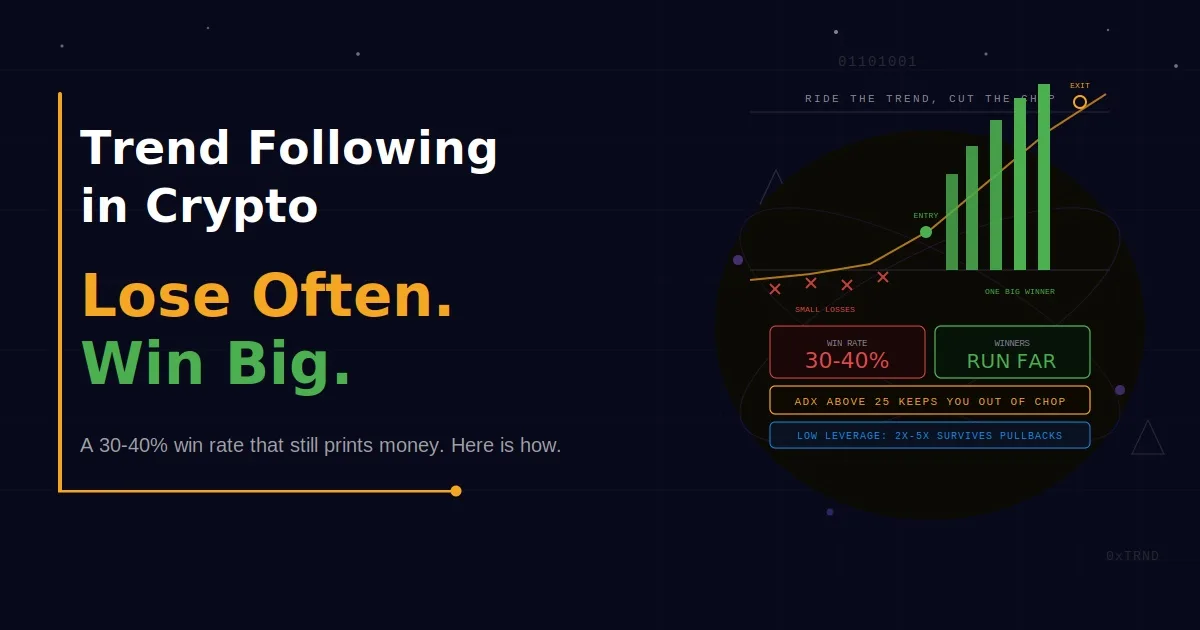
A complete trend following crypto guide. Learn the exact entry methods, exit rules, and filters that keep you in strong trends.
All information on this site is provided by Mubite for educational purposes only, specifically related to financial market trading. It is not intended as an investment recommendation, business advice, investment opportunity analysis, or any form of general guidance on trading investment instruments. Trading in financial markets involves significant risk, and you should not invest more than you can afford to lose. Mubite does not offer any investment services as defined under the Capital Market Undertakings Act No. 256/2004 Coll. The content on this site is not directed toward residents in any country or jurisdiction where such information or use would violate local laws or regulations. Mubite is not a brokerage and does not accept deposits. All trading accounts provided by Mubite are simulated demo accounts using live market data. No client funds are traded on live markets. Payout figures shown are individual results and are not typical. Past performance does not guarantee future results.
Mubite s.r.o., Školská 660/3, Nové Město, ICO: 23221551 Praha 1, 110 00, Czech Republic | Copyright Ⓒ 2026 Mubite. All Rights Reserved.
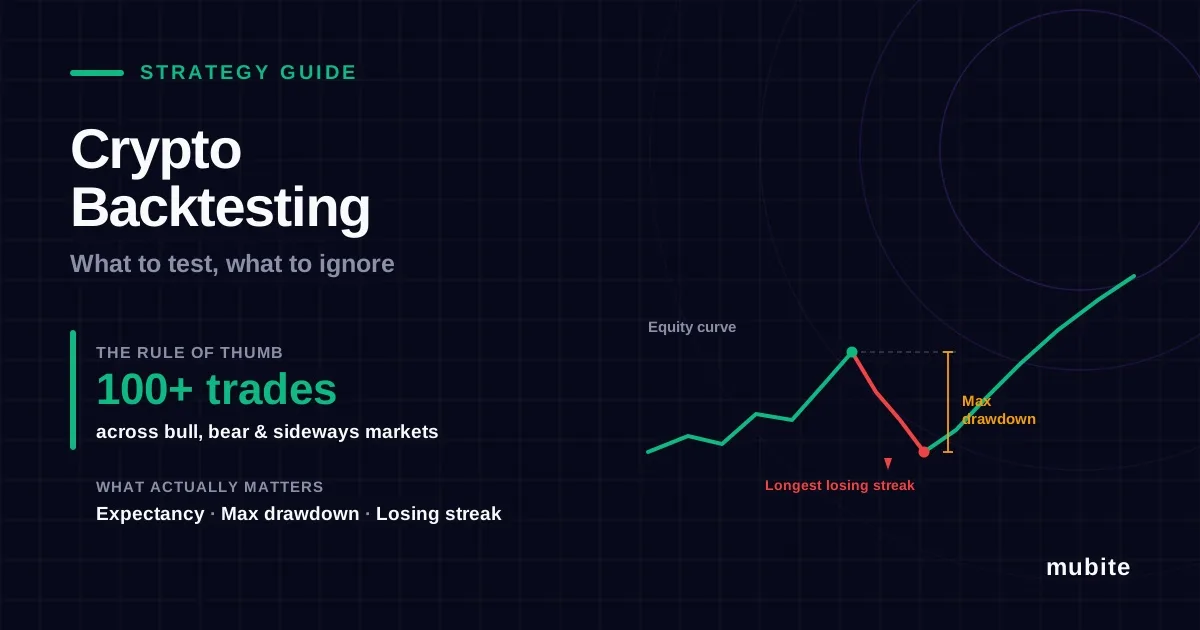
What is backtesting in trading, how to backtest a crypto strategy step by step, which metrics matter, and how to avoid overfitting before you risk real money.
Every trader has a strategy that looks perfect on the chart. The question is whether it worked across hundreds of trades and different markets, or only on the five examples you remember. Backtesting answers that before the market does. Done badly, it gives you false confidence, which costs more than no test at all.
Backtesting means testing your trading rules on historical data to see how they would have performed
Test at least 100 trades, across bull, bear, and sideways markets
Focus on expectancy, max drawdown, and the longest losing streak, not total return
Include fees, slippage, and funding, or your crypto backtest will look better than reality
Avoid overfitting: fewer rules, fewer tweaks, and always test on data you did not optimise on
Forward test next. A strategy is only ready when it holds up in paper trading too
Backtesting is the process of applying a set of trading rules to historical price data to see what would have happened if you had traded them. You record every entry, exit, win, and loss, then measure the results.
A backtest does not predict the future. It filters out strategies that never worked, and shows you what the bad periods look like before you meet them with real money.
Write the rules down first. Entry, stop loss, take profit, position size, and when not to trade, specific enough to apply the same way every time. Our trading plan template is a good starting point
Pick your market and timeframe. Test the pair and timeframe you will actually trade
Choose a data period that includes different conditions. For crypto, that means at least one bull run, one bear market, and one long sideways range. A strategy tested only on 2021 has only been tested on a bull market
Log every trade. Date, direction, entry, stop, exit, result in R (multiples of your risk), and market context. Do not skip the trades you would have "obviously avoided"
Calculate the metrics. Expectancy, win rate, average win and loss, max drawdown, and the longest losing streak (see below)
Test on data you have not seen. Hold back the most recent 20 to 30% of your data, and only test on it once your rules are final
Manual backtesting means stepping through historical charts candle by candle and recording trades as if they were live. It is slower than automated testing, but it suits discretionary strategies like breakout trading and trains your eye at the same time. The key rule: hide the future, or your entries will be better than they ever are live.
TradingView covers both:
Bar Replay hides future candles and plays the chart forward one bar at a time, which makes manual backtesting much more honest. Intraday history depends on your plan. On Essential, for example, you get 6 months of 1 minute data, and Plus extends that to a year (TradingView)
The Strategy Tester runs automated backtests on Pine Script strategies and reports net profit, drawdown, win rate, and profit factor. Set realistic commission and slippage in the properties before trusting any result
| Metric | What it tells you | Warning sign |
|---|---|---|
| Expectancy | Average profit per trade in R | Below 0.1R after costs |
| Max drawdown | The deepest peak to trough loss | Larger than you could sit through |
| Longest losing streak | How many losses in a row to expect | Would breach your loss limits |
| Win rate with reward to risk | Whether winners pay for losers | High win rate but tiny winners |
| Results by market regime | Whether the edge holds in different conditions | All profit from one period |
| Number of trades | Whether the result is statistically meaningful | Fewer than 100 trades |
Expectancy is the number that matters most:
Expectancy = (win rate × average win) - (loss rate × average loss)
A 40% win rate with 2R winners and 1R losers gives (0.4 × 2) - (0.6 × 1) = +0.2R per trade, roughly +20% over 100 trades at 1% risk, before costs.
The losing streak is the number most traders underestimate. At a 40% win rate, a run of 7 or more losses in a row within 100 trades is normal, not bad luck. Your backtest should show it, and your risk to reward and position size need to survive it.
Total return on its own. Without the drawdown that came with it, it means nothing
Small samples. Twenty trades can make any strategy look brilliant or useless
One great period. If most of the profit came from one move, you found an event, not an edge
Perfect fills. Exact lows and exact highs do not happen live
Endless tweaking. If it only works with a 17 period moving average and not 15 or 20, it does not really work
Curve fitting, or overfitting, happens when you keep adjusting rules until they fit past data perfectly. The backtest looks excellent, then fails live, because it learned the noise rather than the pattern. Research by Bailey, Borwein, López de Prado and Zhu shows that high backtested performance is easy to achieve after trying a relatively small number of strategy variations, and the more variations you try, the more likely the result is overfit (Notices of the AMS, 2014).
How to protect yourself:
Keep the rules simple, with as few parameters as possible
Decide the rules before you look at results, and limit how many versions you test
Check that nearby settings still work, not just the best one
Walk forward analysis is a stricter form of out-of-sample testing. You optimise on one window of data, for example 12 months, test on the next unseen 3 months, then roll both windows forward and repeat. If the strategy keeps performing on unseen data, the edge is more likely real.
Fees add up fast. Taker fees on every entry and exit can turn a small edge negative. Model them using real rates, and see our guide to maker vs taker fees
Slippage in fast markets. Breakouts and news spikes rarely fill at your level. Add slippage to every trade, especially on smaller coins
Funding on perpetuals. Holding a perpetual position for days costs or pays funding every few hours. Most simple backtests ignore it
24/7 markets. There is no close, and weekends trade differently from weekdays
Survivorship bias. Testing only on coins that still exist today ignores the ones that collapsed. Stick to liquid majors or include delisted coins
Regime changes. Crypto swings between violent trends and long ranges. Check results for bull and bear markets separately
A backtest tells you a strategy worked on past data. Forward testing tells you whether it works now, and whether you can actually execute it.
Paper trading crypto on a demo account is the simplest form of forward testing. Trade your rules on live prices for 30 to 50 trades and compare with your backtest. If live results are much worse, the cause is usually unmodelled costs, rules you are not following, or overfitting. A trade journal will show you which.
A challenge adds hard limits, so test against them, not just against profit.
Check the worst day. At Mubite, the daily drawdown is 5%, calculated from equity at 00:00 UTC, and floating losses count. Find the worst day in your backtest and make sure it stays inside that limit
Check the worst losing streak. On a $100,000 2-Step account the maximum drawdown is 8%. If your backtest shows 8 losses in a row, risking 1% per trade takes you to the edge of that limit on a single bad streak. Risking 0.5% would not. See drawdown explained and position sizing for prop traders
Forward test before you pay. The Mubite free trial lets you run your strategy on live market data under challenge rules, with no money at risk
Tip from the author: Size your risk from the longest losing streak in your backtest, then add 50%. If your backtest shows 8 losses in a row, plan for 12. Backtests are always a little kinder than the live market, and the losing streak is where that difference hurts most.
Need a strategy to test? Try trend following, mean reversion, or the opening range breakout.
Yes. It will not guarantee profits, but it filters out strategies that never worked and shows you what a normal drawdown looks like.
At least 100, spread across different market conditions. Fewer trades than that, and the results are mostly luck.
Yes. You can backtest manually on any charting platform by scrolling back and hiding future candles, and TradingView offers Bar Replay and a Strategy Tester, with more intraday history on paid plans.
Share it with your community