
Mubite vs Breakout Prop compared on funding, leverage, account sizes, drawdown, and rules. See how the two crypto prop firms differ
A 2:1 risk-reward ratio sounds like a rule for profitability. It isn't. Here's why R:R only works alongside win rate, and how expectancy matters.
How many trades per day is right for day traders, scalpers, and prop traders? The honest answer depends on your style, and overtrading is the fastest way to fail.

All information on this site is provided by Mubite for educational purposes only, specifically related to financial market trading. It is not intended as an investment recommendation, business advice, investment opportunity analysis, or any form of general guidance on trading investment instruments. Trading in financial markets involves significant risk, and you should not invest more than you can afford to lose. Mubite does not offer any investment services as defined under the Capital Market Undertakings Act No. 256/2004 Coll. The content on this site is not directed toward residents in any country or jurisdiction where such information or use would violate local laws or regulations. Mubite is not a brokerage and does not accept deposits. All trading accounts provided by Mubite are simulated demo accounts using live market data. No client funds are traded on live markets. Payout figures shown are individual results and are not typical. Past performance does not guarantee future results.
Mubite s.r.o., Školská 660/3, Nové Město, ICO: 23221551 Praha 1, 110 00, Czech Republic | Copyright Ⓒ 2026 Mubite. All Rights Reserved.
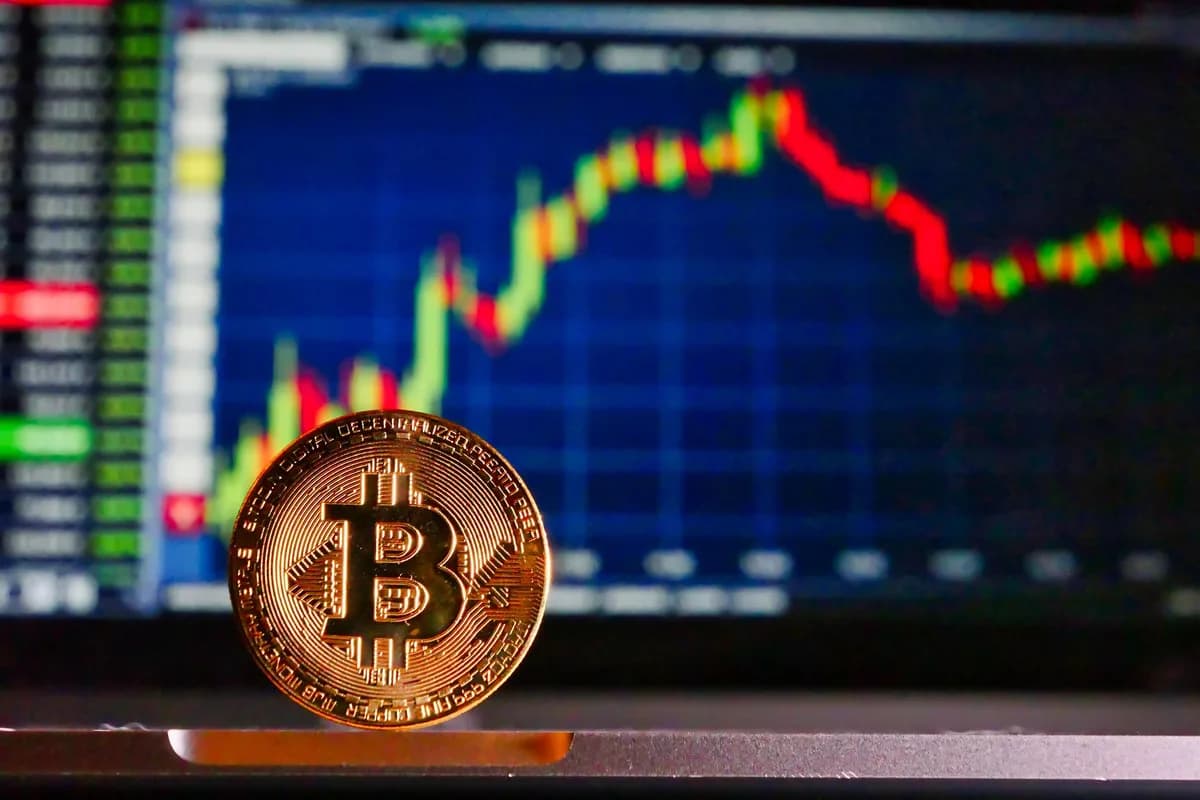
What drives crypto prices? Learn why Bitcoin goes up and down, the three forces behind every move, and how traders use them to stop guessing.
Bitcoin jumps five percent in an hour with no news on your feed. The next day it drops just as fast. If you have traded crypto for any length of time, you have asked yourself what actually makes this market move. The answer is not random candles. It is a handful of forces you can learn to read.
What drives crypto prices? In the short term, crypto prices are driven by three forces: liquidity (how much money is available to flow into risk assets), narratives (the stories that attract attention and new buyers), and positioning (how much leverage traders hold and on which side). Over the long term, supply and demand, adoption, and regulation set the direction.
Crypto prices go up when buyers are more aggressive than sellers, and down when sellers take control. That is true for every market. What makes crypto different is how quickly that balance can flip.
Many traders get stuck here. They watch candles and indicators without understanding the drivers behind them, so the market feels random, and emotions take over. Think of this guide as learning the language of the market. Once you understand what pushes crypto up or down, you stop guessing.
Traditional assets have anchors:
Stocks are tied to company earnings
Bonds are tied to interest rates
Real estate is tied to physical supply and demand
Crypto has no earnings report and no rental yield. It trades 24/7, it is heavily leveraged, and much of its value depends on attention. That is why the daily moves come down to three forces.
"Liquidity is the engine, narratives are the spark, positioning is the pressure."
These forces will not let you predict every spike, but they give you context: whether the engine has fuel, whether a spark is catching, and whether pressure is building.
At the heart of every crypto move is liquidity.
When liquidity expands (central banks easing, a weaker dollar, rising risk appetite), the engine runs at full strength and Bitcoin often rallies
When liquidity tightens (higher interest rates, a strong dollar, risk assets selling off), the engine sputters and crypto struggles
The clearest example is the Federal Reserve. Higher rates drain fuel from the engine, lower rates refill the tank. In 2020, central banks flooded the system with pandemic liquidity, and Bitcoin went from under $5,000 in March 2020 to over $60,000 about a year later.
Liquidity also matters at the exchange level. Thin order books and skewed funding rates mean a single large order can move price several percent on a quiet weekend. For how liquidity shifts across the bigger cycle, see our guide to bull vs bear markets.
If liquidity is the engine, narratives are the spark. A story can ignite the market and pull in new money and attention.
2017: the ICO boom turned Ethereum into "the platform for the future of the internet", and ETH ran from under $10 to over $1,000
2021: NFTs and the metaverse (I was there)
2024: spot Bitcoin ETFs and AI tokens
2025: institutional and treasury buying, with companies adding Bitcoin to their balance sheets
Traders are human, and we love stories. Retail traders chase the story, while institutions read it as a signal of where retail flow goes next.
Tokenomics matters too. A spark dies if the fuel is flawed. Heavy token unlocks, high inflation, or concentrated treasuries can stall a move before it begins.
The final piece is positioning. In a mechanical system, pressure builds when fuel and spark meet. In crypto, leverage does the same.
Traders borrow 10x, 50x, even 100x their capital. When price moves against a crowded side, exchanges force-close those positions, creating liquidation cascades that explain the violent spikes and wicks on the chart. Picture traders heavily short at a key level: once price breaks it, shorts are forced out and the move accelerates upward. Long squeezes work the same way in reverse.
Watching positioning is like watching the pressure gauge. It tells you when the system is about to release energy.
Each force can move markets on its own, but the real power shows up when they interact.
When they align, you get a trend. In January 2024, the SEC approved the first spot Bitcoin ETFs. The narrative was clear: institutions finally had an easy on-ramp. Liquidity was improving as the dollar softened, and traders piled in long. Bitcoin pushed to new all-time highs above $73,000 within two months.
When they collide, you get a crash. On October 6, 2025, Bitcoin set an all-time high near $126,000, and traders were heavily leveraged long. Four days later, a tariff announcement hit a market stacked with longs. More than $19 billion in leveraged positions were liquidated across over 1.6 million accounts, the largest liquidation event in crypto history. The headline was the spark, but positioning decided how violent the move became. By mid-2026, Bitcoin was down more than 40% from that peak.
This is the pattern to train your eye to see:
A story without money behind it fizzles
Liquidity without attention feels slow
Positioning alone explains spikes, not full trends
When all three converge, you get the moves that define entire market cycles
Track global liquidity signals
Watch the dollar index (DXY). A weakening dollar often means stronger crypto
Follow central bank decisions and the FOMC calendar. Loose conditions favour risk assets like Bitcoin
Watch stablecoin supply. Growing issuance often comes before rallies
Follow narratives early
Know what the market is excited about, even if you do not trade it. When a story gains traction on crypto Twitter and in the headlines, flows follow
Monitor positioning data
Check funding rates, open interest, and liquidation maps
Heavily positive funding means longs dominate, and a flush down may come
Negative funding means shorts dominate, and a squeeze higher becomes more likely
Use on-chain data as a lens
Exchange inflows can signal sell pressure ahead, and large token unlocks can cap rallies
For traders who want measurable edges, our guide to the best indicators for crypto prop trading shows how to read momentum alongside these drivers.
Tip from the author, Adam Rohde: Before every session, answer three questions in one line each. Is liquidity loosening or tightening? What story is the market paying attention to right now? Which side is crowded? If you cannot answer all three, you do not have context for the trade, and it is better to size down or wait.
Believing headlines cause the moves. Headlines often arrive after the move. The underlying drivers were already in play. If you trade around releases, read how news trading works first
Ignoring positioning. If everyone is long, the risk is not that price keeps rising. It is that one shakeout triggers mass liquidations
Thinking fundamentals do not matter. Crypto trades like a casino at times, but adoption, institutional flows, and regulation shape the long-term trend
Forgetting how reflexive crypto is. Price itself becomes a driver. Rising markets attract buyers, falling markets accelerate selling. Sentiment does not just reflect price, it pushes it further
No one controls the crypto market, but it is not random. Once you start watching liquidity, narratives, and positioning, the candles on your chart will finally make sense.
"Volatility is not your enemy, it's your opportunity."
Do not aim to predict every move. Aim to understand the forces behind them, then let risk management and trading psychology do the rest.
My challenge to you: pick one of the three forces and track it daily for the next month. To test what you learn on live market data without risking your own money, start with the Mubite free trial.
In the short term, three forces: liquidity, narratives, and positioning. Over the long term, supply and demand, adoption, and regulation set the direction.
Prices rise when buyers are more aggressive than sellers and fall when sellers take control. In crypto, that balance flips fast because the market trades 24/7, uses high leverage, and reacts strongly to stories and global liquidity.
Most sharp daily moves come from positioning. When too many traders are leveraged on one side, a small push triggers liquidations that accelerate the move. Macro events like interest rate decisions and major headlines often act as the trigger.
Supply and demand at the core. Demand comes from adoption, utility, and attention. Supply depends on the token's design, such as Bitcoin's fixed cap of 21 million coins, or the unlock schedule of newer tokens.
Share it with your community